


How to tame the market's skewness
Outperforming the market is hard without a crystal ball. Here's how to tilt the odds in your favour.

.
When you look at the long-term equity index charts moving up and to the right, it’s easy to forget the individual stocks underpinning the indices don’t move up and around as a unified block.
This has important implications for how you try to extract returns from the equity markets and the approach you take to building a quality portfolio.
Beating the performance of the broader share market in any one year isn’t an easy task and, when you look at the data and the facts, the truth is it’s way harder than most people think.
And, as you would expect, it’s even more difficult to beat the market’s performance over multiple years, let’s say over five, 10 and 15 years.
In essence, that’s the Herculean task faced by all active investment managers – whether they be professionals running large portfolios or individual investors with a small portfolio of hand-picked stocks. That is, if you’re investing actively, your whole modus operandi is to beat the broad market averages like the S&P/ASX 300.
Global index provider Standard & Poor’s measures the performance of active fund managers over time. The 2022 S&P Index Versus Active scorecard, widely known in investment circles as SPIVA, showed 57% of actively managed large-cap Australian equity funds (funds that invest in a selection of the largest Australian companies chosen by an investment team) underperformed the S&P/ASX 300 Index last year.
The SPIVA report also shows that active underperformance rates over the longer term were even more dismal.
Over five, 10 and 15-year time horizons actively managed large-cap Australian equity funds underperformed the S&P/ASX 300 Index by 81%, 72% and 83.5%, respectively.
The takeaway here is, when investors go active, they are more likely to be in the long-term majority of the distribution that underperforms rather than the smaller percentage that outperforms. This isn’t just an Aussie thing. We see similar results in equity markets all around the world.
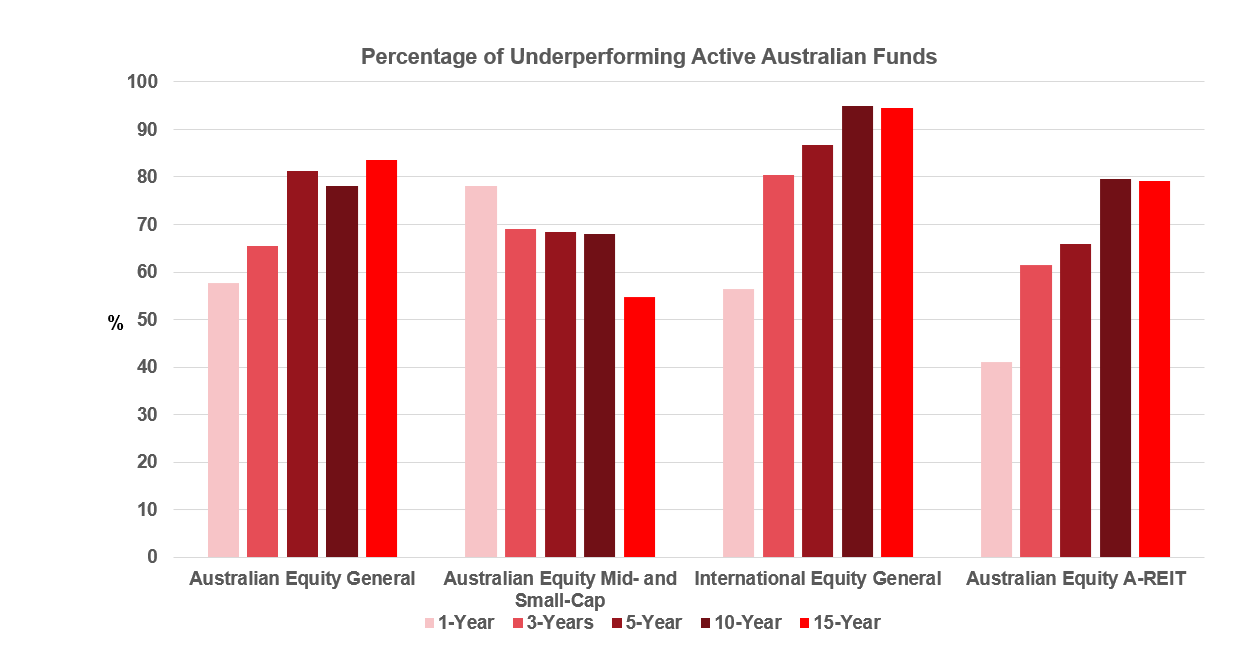
Source: Standard & Poor’s
Costs are a headwind to active
All investors are subject to the costs of participating in the market.
These costs include management fees, bid-ask spreads, administrative costs, commissions, market impact and, where applicable, taxes. These costs can be high and reduce investor returns over time.
And costs create a hurdle that must be overcome to beat the market averages.
Because the average costs of active management are typically much higher than those of index funds, this is a strong headwind that diminishes the chances of successful active outperformance.
The equity market is “skewed”
Before I got into index investing, I assumed that half of all stocks outperformed a market index and the other half underperformed in a given year.
Successful active stock picking meant selecting from the top half, avoiding the bottom half, and making massive amounts of money, or “alpha” as the pros call it.
Unfortunately, that’s not the way equity markets really work. In reality, there are huge tails when you look at the extreme over- and under-performers in the market. This asymmetry is what we call the “skewness” of equity returns.
As shown in the chart below, a positively skewed distribution has a tail which is more pronounced on the right side (positive) than it is on the left (negative).
In a positively skewed distribution, there are a few really large data points way out in the tail that pull the average up. That is, the mean (average) is greater than the median (middle), with the most extreme values on the right side.
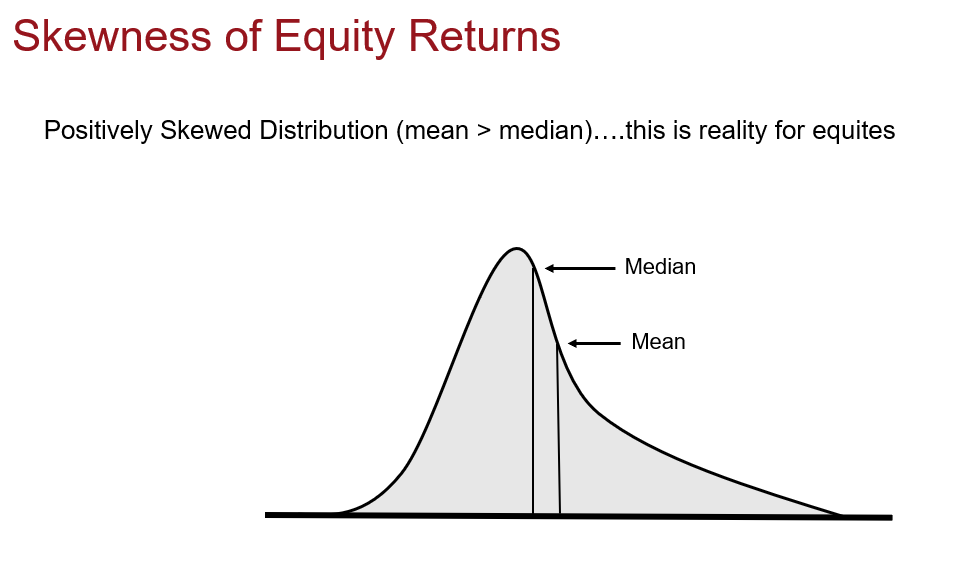
Source: Vanguard
When thinking more deeply about equities, we might intuitively suspect there is a natural tendency towards a right skew—after all, a stock can only go down by 100%, while it can appreciate by way more than that. A handful of stocks go up by 200%, 300%, 500% or 1,000%, and that’s where the bulk of equity index returns really come from.
What this means for investors with a well-diversified portfolio is they typically experience frequent small losses from the majority of stocks, but a few exceptionally large gains from a subset of their holdings.
In 2022, roughly a third (33%) of the top 300 companies outperformed the return from the S&P/ASX 300 Index. So, to outperform the market, an active investor needed to be concentrated in that 33% of outperforming companies.
The 10-year period from the start of 2012 to the end of 2022 shows only 17% of the companies in the S&P/ASX 300 Index beat the performance of the broader market average over that time. Furthermore, the top three ASX stocks (Commonwealth Bank, CSL and BHP) accounted for 24% of the total index return.
This skewness becomes even more pronounced over the 20 years from the start of 2002 to the end of 2022. Only 6% of the companies in the S&P/ASX 300 Index beat the performance of the broader market over this time, with the top three stocks (BHP, Commonwealth Bank and Westpac) accounting for almost one-third of the total index return.
Put another way, if an active investor didn’t have those three particular stocks in their portfolio they would have missed out on a fair chunk of the market’s return.
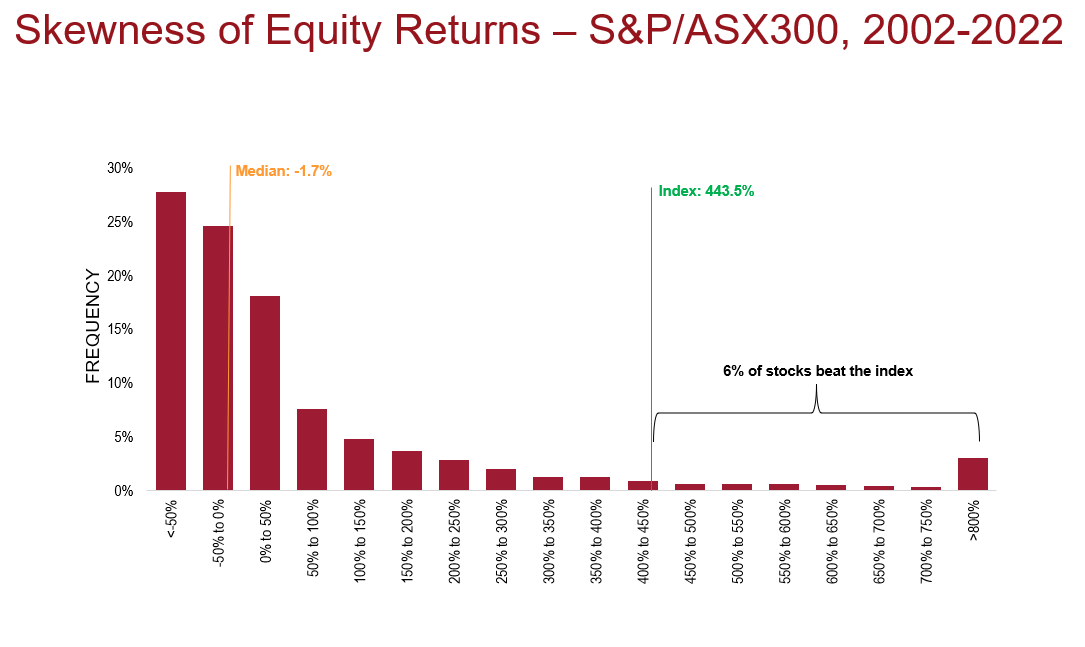
Source: Standard & Poor’s
Striking a balance: Index + Active
So, how can investors position their portfolio to take advantage of this skewness of equity returns?
If there is one takeaway, it’s that index managed funds and exchange traded funds should be a consequential piece of a core equity portfolio.
Think of broad-based index funds as a way to “tame the skewness” of equity markets because they capture the upside of those extreme winners and tilt the odds in an investor’s favour. It’s simply the most efficient way to capture long-term equity market returns.
Now you know why the search for winning active fund managers is a tough and ultimately unrewarding one for most investors. So, consider dialling back your active exposure and dialling up your index exposure.
The core/satellite approach to building a portfolio is a great framework for blending both index and active. Start with a broadly diversified index core holding. Then add some small low-cost active satellite holdings around the margins where you have conviction, unique needs, or access to a truly talented active manager to round it out.
Important Information
Vanguard Investments Australia Ltd (ABN 72 072 881 086 / AFS Licence 227263) (“Vanguard”) is the issuer of the Vanguard® Australian ETFs. Vanguard ETFs will only be issued to Authorised Participants. That is, persons who have entered into an Authorised Participant Agreement with Vanguard (“Eligible Investors”). Retail investors can transact in Vanguard ETFs through Vanguard Personal Investor, a stockbroker or financial adviser on the secondary market.
We have not taken your objectives, financial situation or needs into account when preparing this publication so it may not be applicable to the particular situation you are considering. You should consider your objectives, financial situation or needs, and the disclosure documents for Vanguard’s products before making any investment decision. Before you make any financial decision regarding Vanguard’s products you should seek professional advice from a suitably qualified adviser. . The Target Market Determination (TMD) for Vanguard’s ETFs include a description of who the ETF is appropriate for. You can access our IDPS Guide, PDSs Prospectus and TMD at vanguard.com.au or by calling 1300 655 101.
December 2023
Duncan Burns
vanguard.com.au